This is a tough one... And I have to admit I got slightly stumped by it myself when I asked my pre-calculus students to illustrate the notion of inverse function and they came back asking for hints and examples. Students dislike inverses for how abstract a concept they seem to be, not to mention the bad rep that going against the stream and reversing a process rather than moving forward with it tends to have in our Western societies. Yet, a few moments spent on the impermanence of things make it clear that understanding ways to deconstruct what has been build is a valuable human endeavor. So is looking at a problem from different perspectives, which can be accomplished by changing the subject in a situation. Yes, we all know about the cricket chirping rate versus temperature example, as well as the Celsius/Fahrenheit conversion... evidently some students did come back with pictures of thermometers that had both units measurements on them. More credit to them for paying attention to the examples used in class. Add to this a mile/kilometer speedometer, and that was about it though...
 |
| Picture 1: The log/exp inverse relationship |
Some of the submissions I received from students a bit further along in pre-calculus were similar to picture 1, looking at the graphs of known inverses such as logarithms and exponentials, "because they were told these were inverse of each other". Nevertheless, many students would be hard pressed to explain why these two particular functions actually represent inverses... some might give a graphical explanation based on the idea of reflection across the first diagonal y=x, others might describe the process of obtaining an inverse procedurally by solving for the other variable as shown in the example below collected during a secondary methods class at WITS University in Johannesburg. It is striking however to notice that little connection is established between the graphical properties and the algebraic approach.
"The photo (picture 1) shows the inverse function of an exponential
function. This function is derived by swapping the x and y variables and making
y the subject of the formula which will then make this function a log graph."
I kept thinking that these did not actually get to the core of what an inverse function really represents and truly accomplishes, and that they did not show depth of understanding in students conceptual grasp on inverse functions. Still looking for the aha! moment, I continued sending my students off with an encouraging "See what you can come up with!!" ...
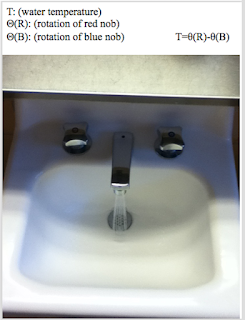 |
| Picture 2: The Inverse Function of a Sink |
... Until one day a very quiet student remembered what I had told them about inverse functions when they were first informally introduced in class (he must have favored taking notes rather than participating in class discussion): that they could basically think of an inverse function as a process that will "undo" the action of the original function. And so standing by the sink one evening, the student reached for their camera and snapped a picture of the warm/cold faucets... Why? Because the cold water will bring the warm water to a lesser temperature, because to adjust one, you might have to turn the other one. Of course the notation used in his description needs some work, but I was baffled by how I had stared at sinks my whole life and never thought of them that way. And here it is, the Selfie that would forever change the way I washed my hands... talk about some Mathematical Awareness thrown into the mix! ... and a bit of work needed on my part as to how I introduce my students to new concepts...

